
It wasn’t long ago that I wrote an article about how I disagreed with the adage, “Sell in May and Go Away.” The major indices shook off a rocky April and soared to new heights, but the question I get all the time is, “With markets at new highs, when is a good time to enter?” What typically happens when markets make new highs? Is it best to wait from here? What I found out might surprise you.
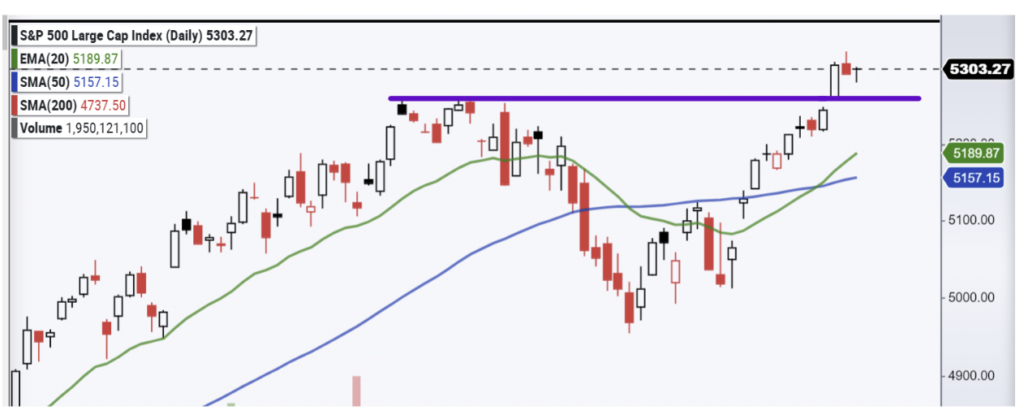
The S&P 500 broke above its April high and posted all-time highs.
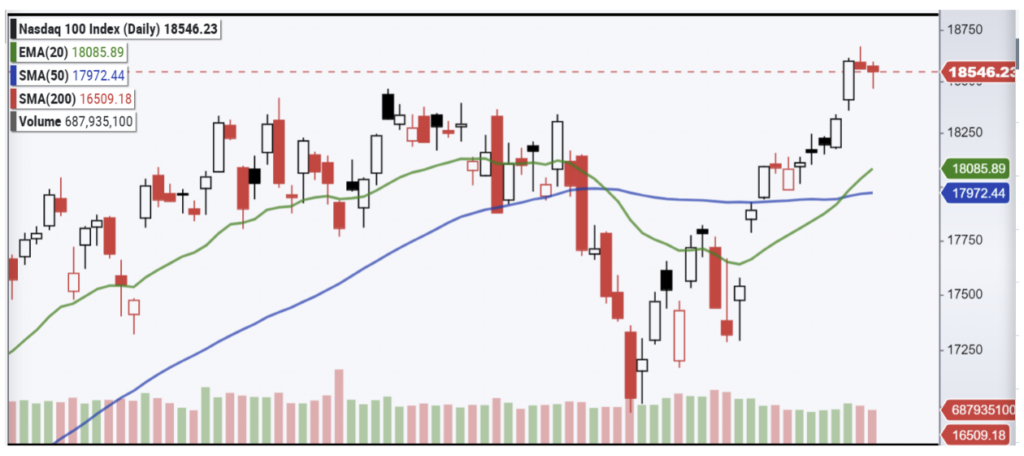
The Nasdaq shared the positive vibes, following a very similar chart pattern.
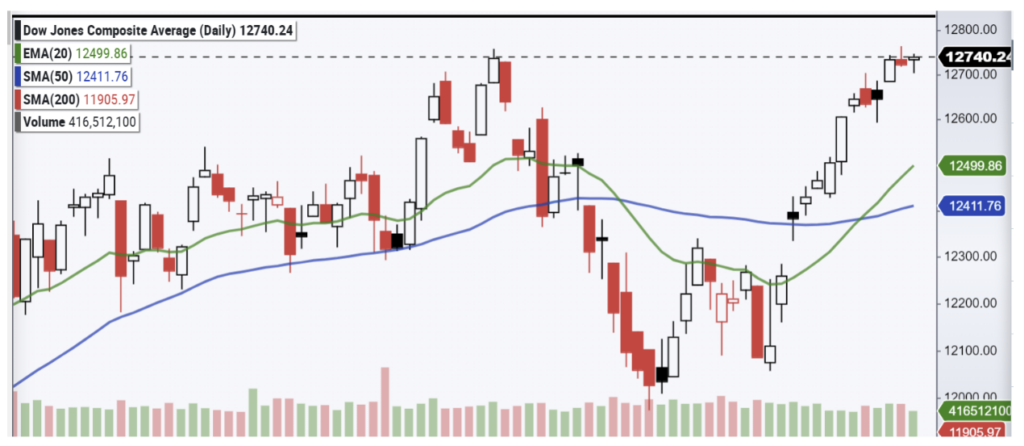
The Dow 30 did break out to new highs, but you can see from the chart below that it hasn’t broken out from the previous highs like the other two.
With an over 5% move in the last 19 days, the question ultimately becomes, how much further can the market go?
Since 1950, following a peak, the S&P 500 index has typically delivered an average total return of 12.7% in the subsequent year, surpassing the 12.4% average for other 12-month periods.
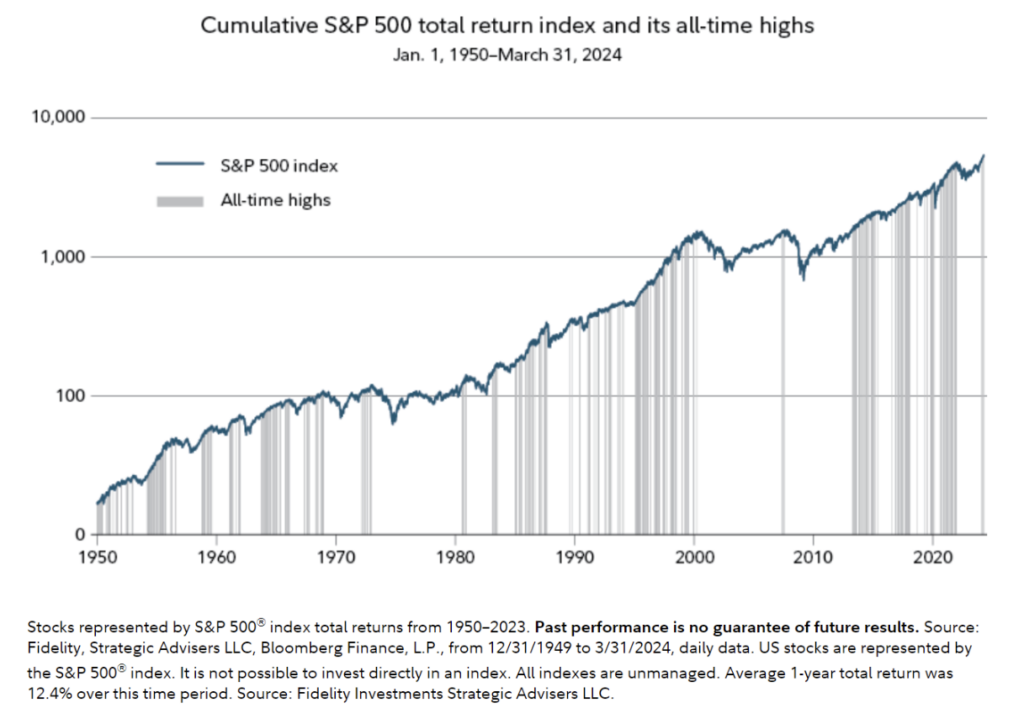
Most people have heard, “buy low and sell high,” the S&P 500 data tells us that historically it has been ok to “buy high and sell even higher.”
Ok, but what is likely to happen next month? Should we go long or short right now? I launched into the data, using the S&P 500 ETF, SPY, and downloading free data from Yahoo Finance.
Rather than looking at all possible 30-day periods, I simplified this and looked at monthly gains using the opening and closing of each month.
Here’s what I found:
- Since the SPY launched in 1993, there have been 377 months of data
- There have been 50 times when the S&P 500 gained 5% in a month (13.26% of the time)
- Of the 50 occurrences when the market finished 5% during a month, the market finished higher the following month 35 times (70% of the time)
- The average gain following a month with a 5% gain was 1.09%
- The 35 times the market closed higher following a 5% monthly gain, the average gain was 3%
- The 15 times the market closed lower following a 5% monthly gain, the average loss was -4%
- The best gain after a month with a 5% gain was 11.32%
- The worst month after a month with a 5% gain was -7.58%
We don’t know what the market will do and past results don’t mean anything, but the data shows that the market has a higher probability (70%) of going higher after a month with a 5% gain.
The data also shows that after a 5% monthly gain, the S&P 500’s average move is 1.09%, with extremes at +11.32% and -7.58%.
What is the takeaway from all of this? Just because the market hit all-time highs doesn’t mean this is the time to sit on the sidelines and wait. You might be sitting out of a possible 11.32% gain next month.
Keep an eye out for Nvidia (NVDA) earnings this week and keep trading what the market gives you.