It’s the end of a wild month. We saw Nvidia blow out earnings once again, treasury yields spiked, putting a damper on the bull rally, and now the market is wondering if a July Fed cut will happen. With most of this earnings season out of the way, rising yields are the headwind of this market moving higher. But why are they rising now? What’s in store for June? Let’s review what the charts tell us.
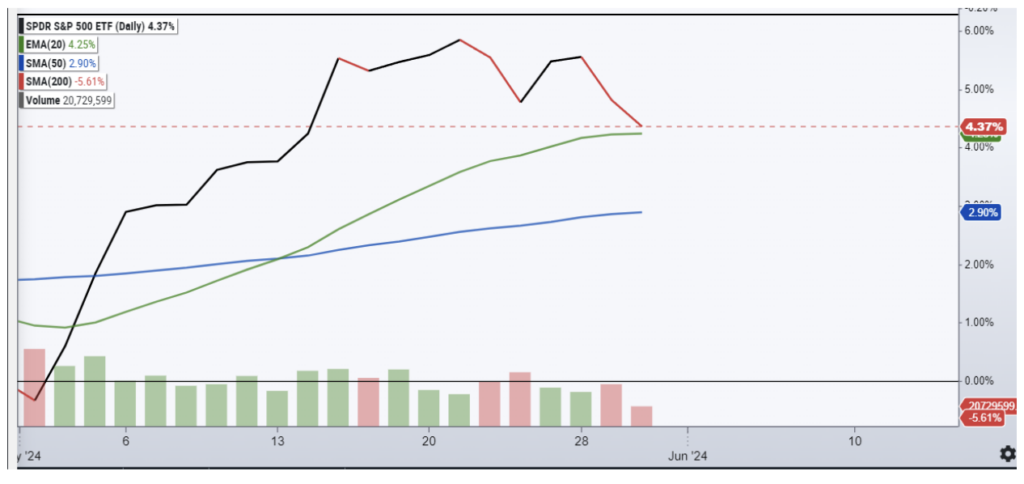
First, let’s look at the roller coaster ride of May. The S&P 500 rose nearly 6% in the month, helped by strong earnings from companies like Nivida (NVDA). After breaking out to new highs, the market retraced some, but it’s still looking to close out the month higher per the SPY percent performance chart below, starting at the beginning of May.
The market was putting the April pullback in the rearview mirror until the Fed spoke and again pushed their narrative of “higher rates for longer,” dashing investors’ hopes for a reduction in interest rates. The probability of a July cut is nearly 0 and we’ll get to September in a moment.
Then came the 10-year treasury scare. In the last few days, the 10-year Treasury spiked above 4.6%, a number it hadn’t seen in May.
You can see from the two charts below that as the 10-year Treasury topped off over 4.7% near the end of April, the S&P 500 took off running to the low side.
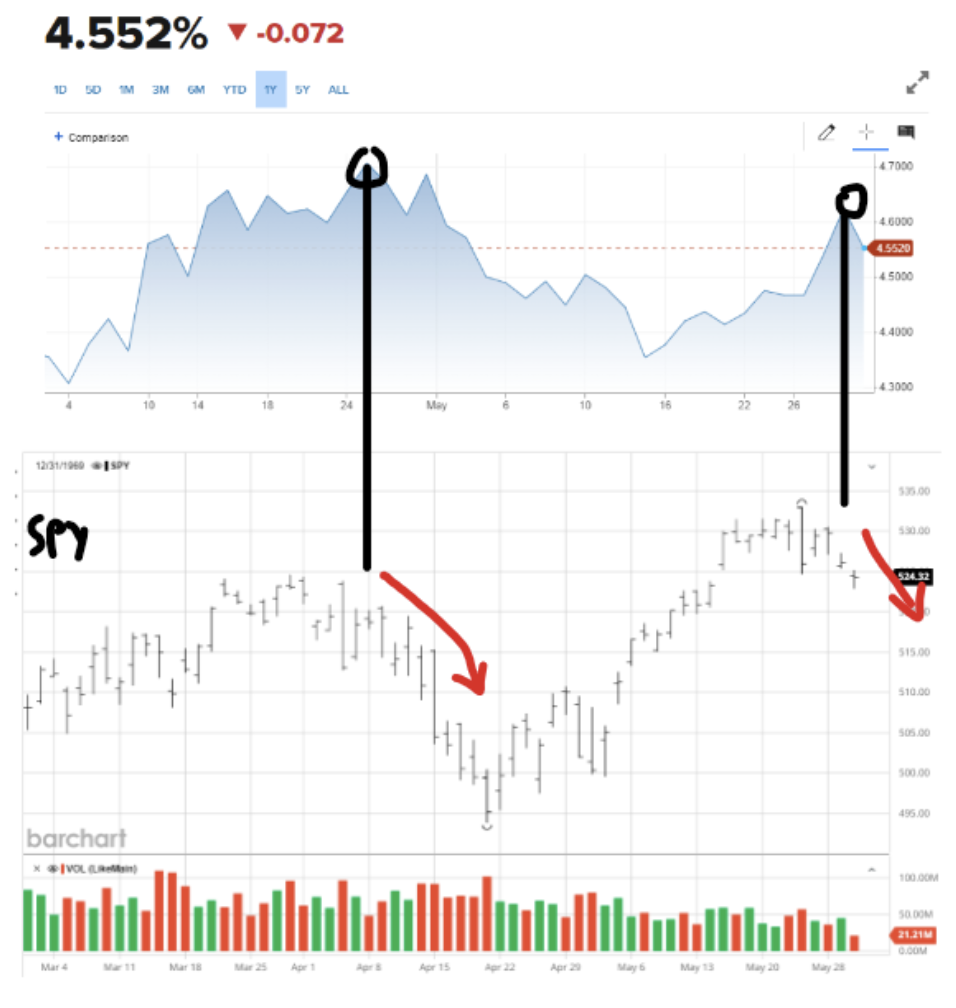
As yields bounced back over the past 10 days, it’s been driven by solid economic data and we’ve seen rate cut expectations get dialed back (September rate cut probabilities have dropped from nearly 90% to just 50%).
Naturally, as rates spiked again at the end of May, investors got worried and the market sold off. We could easily give back about half of May’s gains and remain in an upward trend.
But we haven’t seen rate hike expectations rise meaningfully (thanks mainly to Powell and other Fed leadership commentary over the past few weeks).
So, where does that leave us for June? Where is the market likely going?
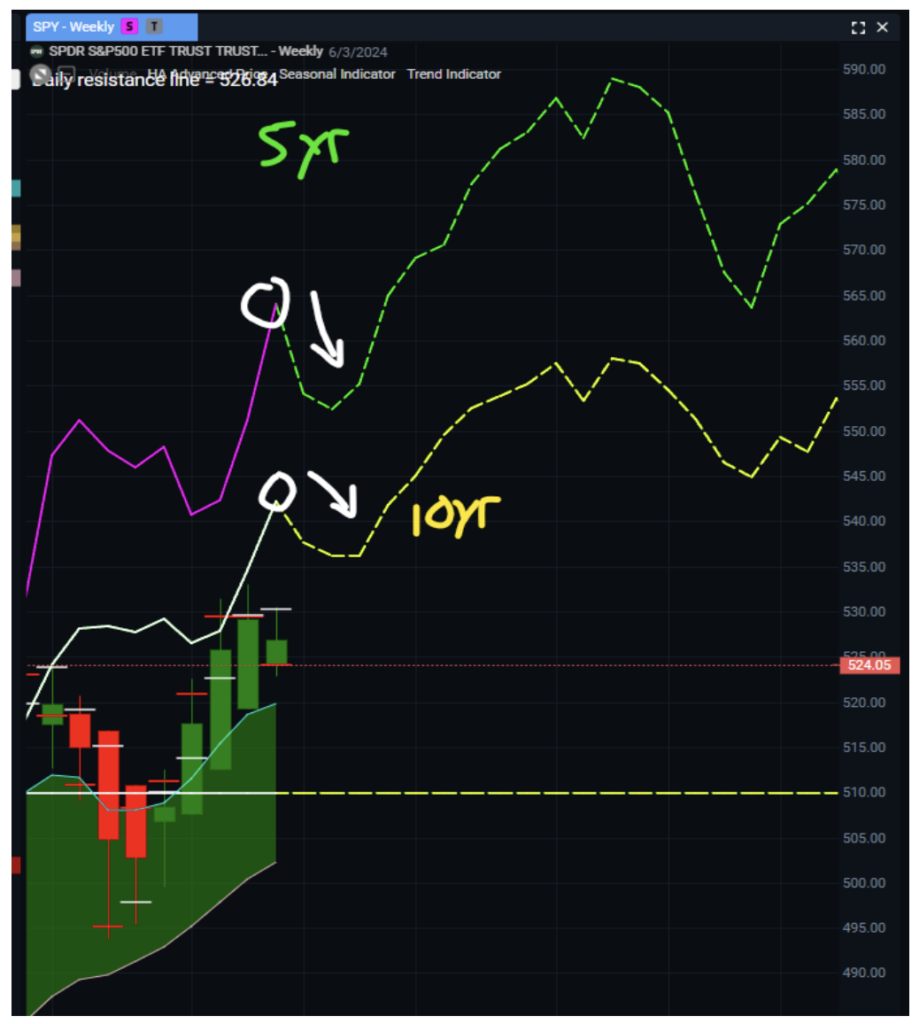
Well, history says the beginning of June tends to be bearish. Earnings season passes and the lack of volume and bullish catalysts have typically pushed the market lower in my birthday month.
The trend over the last 5 and 10 years shows the SPY heads lower into the week of June 17th, before turning higher. The market has been following its seasonality pattern in May with a rebound at the start of the month and coming into weakness at the end..
If economic conditions improve and the Fed does bring up further rate hikes, I’d expect to see the S&P 500 test the 5000 level. Otherwise, I’m looking for short-term support around 5220, then 5180. Longer-term support at 5150 and then at 5000.
To get to 5000 though, it would take another -5%+ pullback, one month after the previous -5%+ pullback occurred. Anything is possible, but that’s rare. Each year the S&P 500 typically sees three -5% pullbacks, but they don’t generally happen one month apart.
Have a great weekend!