While Wall Street certainly liked hearing the Fed reiterate a likely June rate cut, and 3 cuts overall for 2024 (and more planned in 2025-26), there was something Jerome Powell said in the press event that worries me.
He specifically singled out a key factor in how the Fed will manage interest rate policy forward (emphasis is mine here):
“At the same time, reducing policy restraint too late or too little could unduly weaken economic activity and employment.”
Powell noted housing activity and business fixed investment had weakened considerably in the last year, a primary goal in reducing inflation, but equally important to maintaining a consistent pace for growth..
That is, however, the first time he’s mentioned growth, albeit obliquely as a concern for the Fed (meaning, they’re aware of making a policy error and cutting rates too late to forestall a recession).
So, my calendar for rate cuts in 2024 looks like this: June, November, December. I don’t see the Fed enacting back to back cuts in the summer meeting cycle; September is out in my mind due to the election.
On the chart, resistance to higher highs on the S&P 500 will come down to:
- Continued, if slow, declines in core inflation metrics (Core PCE by Fed standards)
- Expansion in Manufacturing and Services, as measured by PMIs (readings above 50 = expansion)
- Unemployment rate <4.0 – 4.2%
- Declining 10-Yr, 2-Yr and 3-Mo US Treasury yields
On the chart (SP500) an uptrending channel running since mid-January, early March turned sideways, but the indices remain bullish. As long as AI enthusiasm and economic growth maintain current paces, there’s a path to 6000 on the S&P 500.
The Fed can help that path with rate cuts, even if they occur slowly in 2024, as it reduces cost impact to tech and small business (micro, and small to mid-caps, especially), which in turn increases earnings, which then justifies the current 21x multiple for 2024 earnings.
Plus, as we reach June, Wall Street will begin pricing in 2025 earnings expectations, and with a total forecast of 6-7 rate cuts in the next 20 months, you can bet the street will be all-in and raising limits.
Which is why I wouldn’t be surprised if we catch a run-up to 6000 on the S&P 500 Index (+14% from current levels).
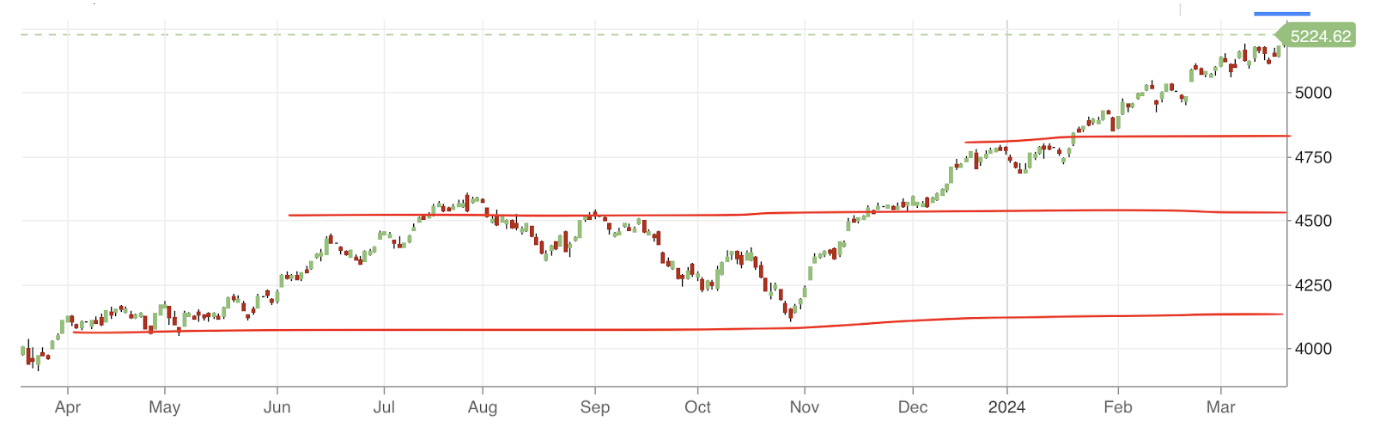
(Chart courtesy of CNBC.com – red lines are my primary support/resistance levels for SPX)
That being said, risks remain. If – and I stress if – we see growth challenged, primarily in the ISM Services index falling below 50, or a rapid change in unemployment, the risk of a -10% to -20% decline is very real here.
To give you an idea:
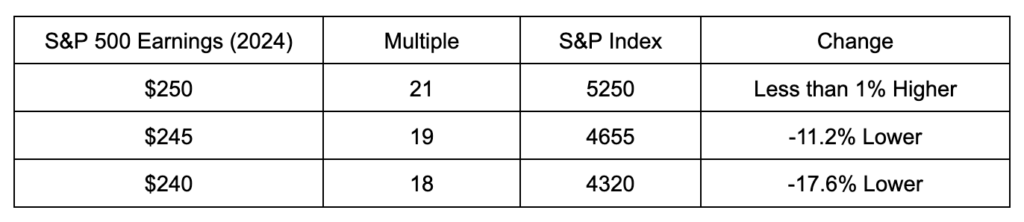
This table shows that Wall St. is pricing out ahead of the high end of earnings expectations, leaving us susceptible to any disappointment – and there are always disappointments – in the months ahead.
Does this mean the market is about to collapse?
No.
It does mean you need to stay out ahead of the 4 core drivers behind the bullish rally and be aware that any change in those metrics can put this rally at risk of a rapid reversal.
As we work through Q2, I’ll be watching for potential in small caps, housing, materials and technology stocks to be the stronger performers, and our future issues of Filthy Rich, Dirt Poor will share ideas in those spaces.
Thanks for reading! We’ll be back on Monday morning with a weekly recap and a look ahead to next week.